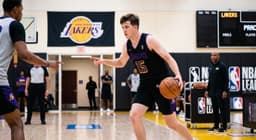
Point Guard Efficiency and Playmaking Metrics: Decoding Basketball Decision-Making
In modern basketball, evaluating point guard efficiency demands far more than tracking simple scoring averages. True elite playmaking relies on superior basketball decision-making under pressure. While raw assist totals capture high-volume output, deeper playmaking metrics—led by the assist-to-turnover ratio—provide immediate clarity into a floor general's true value. Analyzing these crucial ball security stats reveals how effectively a primary ball-handler generates high-value scoring opportunities while protecting the basketball on every possession.
For any primary playmaker competing at the highest level, protecting the ball is paramount. Every turnover is a lost possession that frequently converts into easy transition points for the opponent. While raw assist numbers capture pure passing volume, the assist-to-turnover ratio serves as an efficiency report card.
Decoding the Benchmark: What Defines Elite Ball Security Stats?
What constitutes a high-level assist-to-turnover ratio in today's fast-paced game?
Historically, a 3.0:1 ratio is considered the baseline benchmark for starting-caliber NBA point guards—meaning a player generates three assists for every single turnover committed. Players exceeding this threshold—approaching or surpassing 4.0:1 or higher—are operating at an elite tier of decision-making and ball conservation.
Maintaining a 4.0+ assist-to-turnover ratio while averaging over 9.0 assists per game indicates extraordinary court vision. These rare playmakers manipulate defensive coverages with eye discipline and timing rather than forcing risky passes into traffic.
To understand how player archetype influences these figures, compare how top NBA floor generals stack up across key efficiency indicators:
Playmaker Archetype & Efficiency Benchmarks
| Player | Usage Rate (USG%) | Assist-to-Turnover Ratio | Primary Playmaking Style |
|---|---|---|---|
| Tyrese Haliburton | 21.7% | 5.75 : 1 (9.2 APG / 1.6 TOV) | High-Volume / Historic Efficiency |
| Mike Conley | 17.5% | 3.85 : 1 | Low-Usage Game Manager |
| Chris Paul | 15.8% | 4.35 : 1 (7.4 APG / 1.7 TOV) | Pace Controller / Veteran Orchestrator |
| Luka Dončić | 35.8% | 2.08 : 1 (8.3 APG / 4.0 TOV) | Heavy-Usage / High-Variance Creator |
| Trae Young | 30.2% | 2.47 : 1 (11.6 APG / 4.7 TOV) | High-Volume / High-Risk High-Reward |
High-Volume Creators vs. Pure Game Managers in Playmaking Metrics
When analyzing playmaking metrics, context is essential. A critical distinction must be made between high-usage offensive engines and disciplined game managers.
1. High-Volume Heliocentric Creators
Superstars like Luka Dončić and Trae Young shoulder high Usage Rates (USG%), often exceeding 30–35%. Because they are tasked with generating almost all of their team's offense late in shot clocks, they regularly attempt high-variance, high-risk passes (such as cross-court skip passes or tight-pocket passes through double teams). Consequently, their raw assist-to-turnover ratio may hover between 2.0:1 and 2.5:1. This lower ratio is often an acceptable trade-off given the sheer volume of high-value scoring chances they generate.
2. Pure Game Managers
Veterans like Chris Paul and Mike Conley prioritize ball preservation and systemic flow over high-risk playmaking. While their overall scoring totals may be lower, their ability to deliver a 4.0:1 or higher ratio ensures their team consistently wins the possession battle.
To evaluate floor generals comprehensively, analysts look beyond the basic ratio to several complementary ball security stats:
Turnover Percentage (TOV%): The percentage of a player's total possessions that end in a turnover.
Assist Percentage (AST%): An estimate of the percentage of teammate field goals a player assisted while on the court.
Potential Assists: Passes by a player that lead directly to a shot attempt, free throw, or foul, removing teammate shooting variance from raw assist metrics.
The Impact of System Context and Roster Composition
A point guard’s efficiency rating is never generated in a vacuum—it is heavily influenced by offensive structure and surrounding talent.
1. Offensive Scheme: A structured motion offense with rapid ball movement creates wide passing lanes and reduces double-team pressure. Conversely, isolation-heavy schemes force guards to make tight-window passes against settled defenses.
2. Surrounding Finishing Ability: Playing alongside elite rim-runners or lethal catch-and-shoot wing players naturally converts potential passes into actual assists, boosting the guard's ratio.
3. Screening & Spacing: Inconsistent screeners or non-shooting lineups collapse the floor, forcing playmakers into tight traffic where turnover risks spike.
Assessing the True Floor General: Mental Mastery Over Physical Metrics
Ultimately, tracking point guard efficiency provides insight into the mental aspect of basketball that raw scoring or athletic testing cannot measure. High-level basketball decision-making requires processing defensive coverages in real time, anticipating rotations, and understanding time, score, and momentum.
Floor generals who consistently protect the ball while setting up high-percentage shots are invaluable championship assets. While highlight-reel passes capture social media attention, it is the quiet, sustained efficiency captured by top-tier playmaking metrics that drives winning basketball over an 82-game season.
Stay on top of every fast break and buzzer-beater with TigerScores, your home for live NBA and college hoops updates. From real-time box scores to season-long player stats, we provide the essential data every basketball fan needs to follow the game.


Victor Wembanyama: Sophomore Season Retrospective & San Antonio Spurs Development
PBA Transition Offense: The Evolution of Fast-Break Strategy
Point Guard Efficiency and Playmaking Metrics: Decoding Basketball Decision-Making
Mastering Volleyball Setting Techniques: Setter Distribution Strategy & Tempo Tactics
Erling Haaland Goals & European Campaign Preview: Manchester City Striker Targets Glory
Terrafirma Dyip Roster vs Macau Giant Pandas Match: PBA International Game & Basketball Showdown Analysis
NBA Roster Rules: Understanding Two-Way Contract Salary & G League Player Development (2026-27)
Inside Luka Dončić's Historic Usage Rate & Offensive Creation
Basketball Fundamentals: Master the Box Out Technique & Defensive Rebounding Drills
Lamine Yamal Stats & Development: How Barcelona Protects Its Premier Young Talent